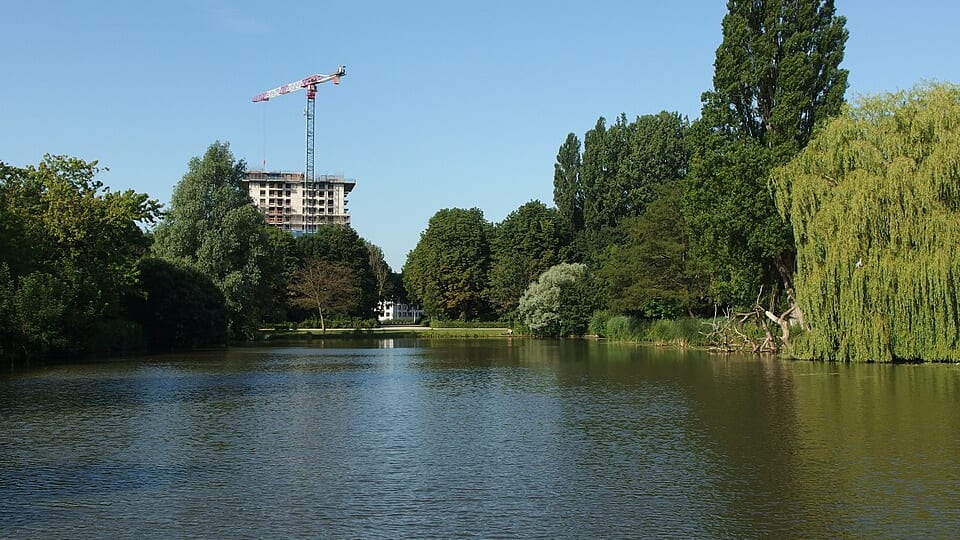
De Omval● live
Oost · 709 residents
3.8%
natural green space
15x the Amsterdam average of 0.3%
#189 of all 518 neighbourhoods
Green space per resident23.3 m²
Tree density16.5
Natural green space3.8%
Neighborhood typeAn average number of trees per hectare
Tree density compared with the neighbouring buurten
The buurten in wijk Omval/Overamstel
Tree density index per buurt: the real number of registered trees divided by land area, rescaled against the city average. Not measured canopy cover.
Did you know? Below Sea Level: A polder lying about 5 meters below the rest of Amsterdam. (fact about Watergraafsmeer)
Our proposal for this neighborhood: This buurt sits at or above the city average: the task is holding on to what is there as it densifies further.
Our own suggestion, not a municipal plan - no source exists for what still ought to be built.
Adopt a tree pit on your street and add more flowers for bees and butterflies.Adopt a tree pit →