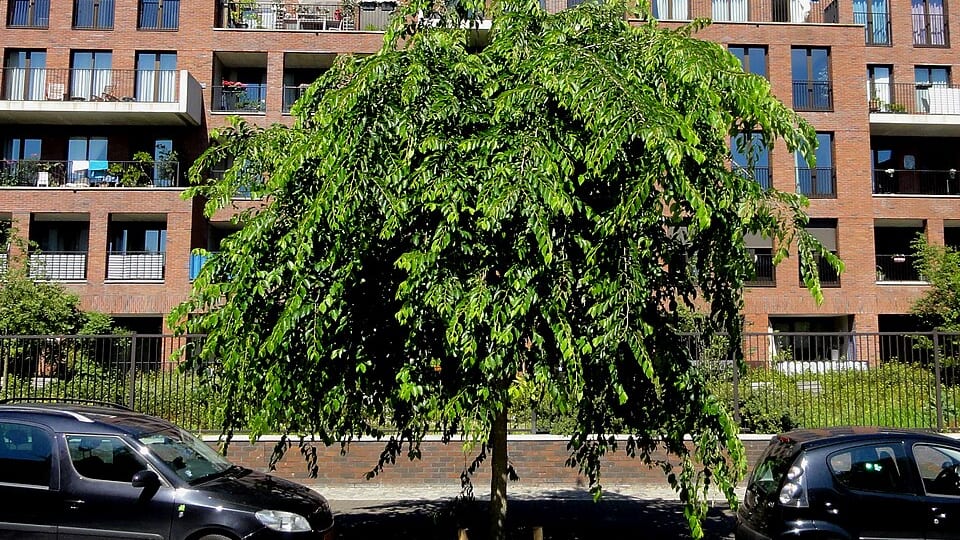
Joris Ivenspleinbuurt● live
Oost · 2,942 residents
4.2 m²
green space per resident
70% below the Amsterdam average of 14.2 m²
#297 of 442 comparable neighbourhoods
Green space per resident4.2 m²
Tree density17.2
Natural green space0%
0% here is measured, not unknown: the BGT registers no natural greenery in this neighbourhood. What green there is has been landscaped, such as parks and street trees. Almost half of Amsterdam's neighbourhoods read 0%.
Neighborhood typeAn average number of trees per hectare
Tree density compared with the neighbouring buurten
The buurten in wijk IJburg-West
Tree density index per buurt: the real number of registered trees divided by land area, rescaled against the city average. Not measured canopy cover.
Did you know? Artificial Archipelago: A totally artificial neighborhood on man-made islands raised from the IJmeer with dredged sand. (fact about IJburg)
Our proposal for this neighborhood: Little public green per resident at high residential density: removing paving and adding street trees is the most promising route here.
Our own suggestion, not a municipal plan - no source exists for what still ought to be built.
Join NK Tegelwippen (the national 'tile-flipping' challenge) and replace paving in your garden with greenery - good for water storage and bees.Join NK Tegelwippen →