Molenwijk● live
Noord · 3,067 residents
53.7 m²
green space per resident
4x the Amsterdam average of 14.2 m²
#74 of 442 comparable neighbourhoods
Green space per resident53.7 m²
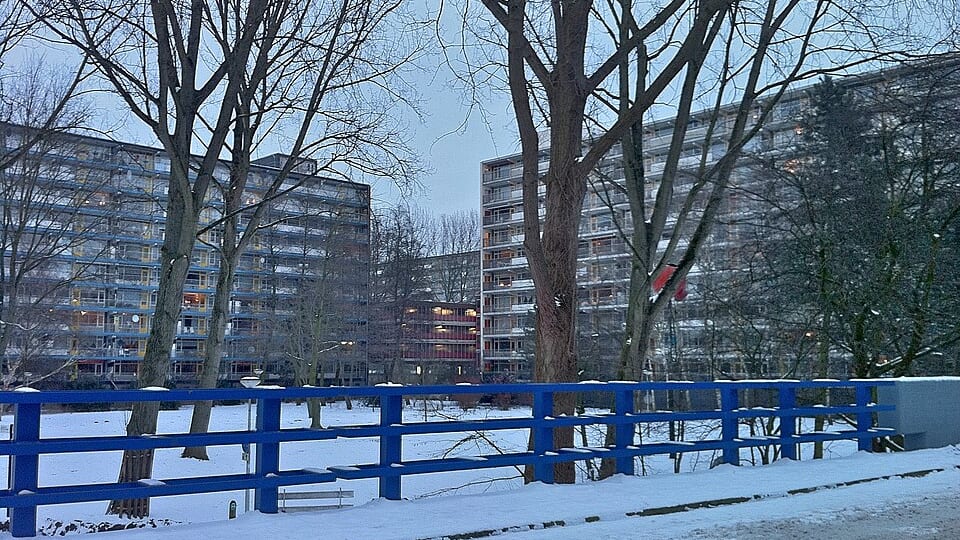
Tree density45.8
Natural green space0%
0% here is measured, not unknown: the BGT registers no natural greenery in this neighbourhood. What green there is has been landscaped, such as parks and street trees. Almost half of Amsterdam's neighbourhoods read 0%.
Neighborhood typeMany trees per hectare - plenty of street shade expected
Tree density compared with the neighbouring buurten
The buurten in wijk Oostzanerwerf
Tree density index per buurt: the real number of registered trees divided by land area, rescaled against the city average. Not measured canopy cover.
Did you know? Mill Types: Bergmolen, bovenkruier, grondzeiler, paltrok, petmolen, rosmolen, schipmolen, spinnekop, standerdmolen, tjasker, torenmolen, walmolen, wipmolen - the streets are named for kinds of windmill.
Our proposal for this neighborhood: The green that exists here is almost entirely landscaped: ecological verge management and flowering edges are the first gain.
Our own suggestion, not a municipal plan - no source exists for what still ought to be built.
Adopt a tree pit on your street and add more flowers for bees and butterflies.Adopt a tree pit →